Improve a hyperspectral imagery processing pipeline with Dagster

Part 2 of posts about using Wyvern's hyperspectral imagery Open Data Program for Harmful Algal Bloom (HAB) detection. Let's port the pipeline to Dagster, a production-grade data orchestrator package...
Recap: In Part 1, I put on my Data Scientist hat and tried some exploratory data analysis using Wyvern's hyperspectral imagery program. The Jupyter notebook produced in Part 1 was a quick study and does not represent production quality Python, routines, or algorithms.
Moving right along!
Why use a data orchestrator like Dagster?
Dagster is a data orchestrator built for data engineers, with integrated lineage, observability, a declarative programming model, and best-in-class testability.
As a data engineer and software developer I've worked on many data pipelines, helped scientists deploy their code, and produced data products in collaboration with scientists and business stakeholders across tech startups, government agencies, and non-profit organizations.
There is an anti-pattern which to be honest seems to be the default and the status-quo. I've perpetuated this problem, OK let's just call it a mistake. My colleagues have made this mistake too. It usually plays out like:
- 💡 We need to create some kind of data pipeline, workflow, or extract-transform-load (ETL), and we need it as soon as possible! (Let's call it a "pipeline" for this post.)
- 🐍 We already know a programming language, like Python, Bash, or TypeScript.
- 🚧 We start coding the pipeline in our favorite language, using tried and true procedural and
object-oriented coding techniques like:
- For Loops
- If-Else Clauses
- Classes and instances with state
- Exception Handling
- 🔥 Yeah! Making progress immediately, so we should have something prototyped within a few days, then it should be slam dunk to get it ready for production!
- ⏳ Much time passes.
- 🪳 We now have a brittle, incomplete, hard to maintain, bad approximation, of a data orchestration tool!
In the following two sections, I pulled some insightful quotes from some other engineers about data pipelines:
Opaque and fragile pipelines
Quoting Brian Davis of Earthmover.io in TensorOps: Scientific Data Doesn’t Have to Hurt:
Every dataset in the status quo is the sum of all its pipeline’s constituent steps. The serial nature of this arrangement has serious implications:
- Did you discover a data error introduced upstream that needs cleaning or correction? Regenerate the whole dataset.
- Do you need to tweak the calculation for a derived quantity? Regenerate the whole dataset.
- Do you want to inline a new variable upstream to improve your model? Regenerate the whole dataset.
- Does your customer want a subtly different deliverable? Rewrite the whole pipeline... then regenerate the whole dataset.
In short, every iterative change anywhere within a pipeline incurs the cost of a wholesale re-run. And this means that, once you’ve moved past the prototyping phase, development slows to a crawl as the value of any incremental improvements must be weighed against the cost of re-running the whole pipeline. All that extra compute time. All that extra storage cost. It’s too expensive, in time and resources and — most importantly — opportunity.
Perks of having an orchestrator in your data eng. toolkit
Quoting Matt Palmer in a Technical Guide published by O'Reilly and Databricks:
Here’s a breakdown of the perks that come with having an orchestrator in your data engineering toolkit:
- Workflow management: Orchestrators assist in defining, scheduling, and managing workflows efficiently, ensuring tasks are executed in the right order by managing dependencies.
- Automation: As engineers, we should be automating as much as possible (or feasible). Orchestrators can be used to automate routine, repetitive, and even complex tasks, saving time and ensuring tasks run as scheduled without manual intervention.
- Error handling and recovery: Orchestrators often come with built-in error handling and recovery mechanisms. They can retry a failed task, notify the team, or trigger other tasks to fix the issue.
- Monitoring and alerting: Monitoring workflows and receiving alerts for failures or delays are crucial for maintaining reliable data pipelines. Orchestrators provide these capabilities.
- Resource optimization: By managing when and where tasks run, orchestrators help optimize resource use, which is crucial in environments with limited or costly resources.
- Observability and debugging: Orchestrators provide a visual representation of workflows, log management, and other debugging tools, which is invaluable for troubleshooting and optimizing workflows.
- Compliance and auditing: Orchestrators maintain an audit trail of all tasks, which is crucial for compliance with data governance and other regulatory requirements.
Pros and Cons of Jupyter Notebooks
The pipeline developed in Part 1 was purely exploratory data analysis (EDA) and that analysis was delivered as a Jupyter Notebook. Notebooks are widely used in Data Science for prototyping ideas as well as sharing technical documentation with interactive scripts, in languages such as Python, Julia, or Mojo.
Notebooks are a powerful tool for communication and sharing. For example Jeremy Howard's FastAI Book, Deep Learning for Coders with Fastai and PyTorch: AI Applications Without a PhD is completely written and published with Jupyter notebooks.
There are definitely some gotchas though:
- Global variables (state)
- Out of order cell execution
- Lack of code quality tools like type checking, linting, formatting, security scanning etc.
Port the data pipeline to Dagster
What's a DAG?
The "Dag" in Dagster stands for Directed Acyclic Graph, which is a useful concept to be aware of. Dagster's framework enables a modular, declarative approach to data engineering, making it easier to manage dependencies, monitor execution, and ensure data quality.
Scaffold a new Dagster project
Following the Dagster quickstart, first, we'll install the projects dependencies per the Dagster docs, including the fantastic uv package manager for Python:
- Scaffolding steps
- Source code (shell)
- Install uv package manager
- Use uv to create a new dagster project named "hab-detection-wyvern-hsi-dag" using create-dagster.
- Add rest of python dependencies, copied from the Jupyter notebook.
- Add new pystac-client dependency for dynamically querying the Wyvern STAC.
- Make materialize assets persistent across runs of the dev server.
# macOS and Linux installation of uv package manager
$ curl -LsSf https://astral.sh/uv/install.sh | sh

# Use uv to create a new dagster project named "pipeline" using create-dagster.
# Respond y to the prompt to run uv sync after scaffolding.

$ uvx create-dagster@latest project hab-detection-wyvern-hsi-dag
...

# It created a scaffold of a project, including a Python venv and README.

$ tree -a hab-detection-wyvern-hsi-dag/
hab-detection-wyvern-hsi-dag/
├── .gitignore
├── .venv/...
├── pyproject.toml
├── README.md
├── src
│   └── hab_detection_wyvern_hsi_dag
│       ├── __init__.py
│      ├── definitions.py
│      └── defs
│          └── __init__.py
├── tests
│  └── __init__.py
└── uv.lock

# Add rest of python dependencies, copied from the Jupyter notebook
$ uv add rasterio shapely geopandas numpy
...

# Add new dependency for dynamically querying the Wyvern STAC:
$ uv add pystac-client
...

# Couple of housekeeping details, this makes materialized assets
# persistent across runs of the dev server
mkdir -p  ~/.dagster
export DAGSTER_HOME=~/.dagster
Now a Dagster pipeline is created, Python dependencies are installed, and we're ready to code!
Scaffold an assets file
This is simply step 2 of the Dagster Quickstart:
$ dg scaffold defs dagster.asset assets.py
...
The following steps of the Quickstart are
- Add data
- Define the asset
- Run the pipeline
- Verify the results
Here we'll diverge from the Quickstart, because this pipeline will fetch data from Wyvern's STAC catalog, and derive other downstream data from there. There will be corresponding assets in each node of the pipeline.
Declarative workflows are the best
In Dagster you express declaratively what the inputs and outputs are for each node in the DAG. Concerns like control flow, logging, serialization, etc. are handled by the orchestrator. Here is one node from this pipeline, illustrating the declarative, Pythonic syntax.
@dg.asset
def green_r550_raster(fetch_stac_item: Item) -> tuple[np.ndarray, dict[str, Any]]:
    """
    Read band from cloud object storage (Green 550nm for NDWI and RGB preview).
    Returns tuple of (Numpy ndarray, raster metadata).
    """
    cog_asset = fetch_stac_item.assets[COG_ASSET_KEY]

    with rio.open(cog_asset.href) as src:
        band_green_r550 = src.descriptions.index("Band_550")
        nodata_val = src.nodatavals[band_green_r550]  # 0-based index
        green_r550 = src.read(band_green_r550 + 1)  # read() uses 1-based index
        meta = src.meta.copy()

    green_r550[green_r550 == nodata_val] = np.nan
    meta["count"] = 1
    return (green_r550, meta)
Using this declarative Python syntax, I added assets for each of the pipeline nodes from Part 1 (see Concept of a production pipeline). Even at this early stage, Dagster can wire up the whole pipeline and visualize it, as shown below:
# validate pipeline config
dg check defs

# launch development server on localhost:3000
dg dev
Implement all the asset nodes
The DAG implementation at this stage involves copying Python code from the Jupyter Notebook
cells, and then passing data between the asset
nodes. Dagster has about a
dozen built-in I/O managers to choose from, but for this introduction, we'll just use the default
FilesystemIOManager.
Discovering parallelism naturally
The process of creating the pipeline and passing data between the assets naturally decomposes the problem. For example, in the Part 1 Jupyter notebook, there was one cell which - serially - fetched 6 raster bands from object storage.
with rio.open(tampico_mx_url) as src:

    # Blue 464nm for RGB preview
    band_blue_r464 = src.descriptions.index("Band_464")
    blue_r464 = src.read(band_blue_r464 + 1)

    # Green 550nm for NDWI and RGB preview
    band_green_r550 = src.descriptions.index("Band_550")
    green_r550 = src.read(band_green_r550 + 1)

    # Red 650nm for RGB preview
    band_red_r650 = src.descriptions.index("Band_650")
    red_r650 = src.read(band_red_r650 + 1)

    # Dark Red 669nm for NDCI
    band_red_r669 = src.descriptions.index("Band_669")
    red_r669 = src.read(band_red_r669 + 1)

    # Red Edge 712nm for NDCI
    band_red_edge_r712 = src.descriptions.index("Band_712")
    red_edge_r712 = src.read(band_red_edge_r712 + 1)

    # NIR 849nm for NDWI
    band_nir_r849 = src.descriptions.index("Band_849")
    nir_r849 = src.read(band_nir_r849 + 1)
    ...
Certainly the above code cell could have been optimized to use async or multiprocessing Python code, but that's extra coding, and an optimization that was not really intended in the exploratory data analysis.
It turns out to be obvious how parallelize that using Dagster assets. As a bonus, the control flow and parallelism comes for free from the data orchestrator.
Here is a visualization of the pipeline from the Dagster development server. The six raw bands are modeled as separate Dagster assets, and therefore are materialized (generated) in parallel.
Visualization of DAG 🎨
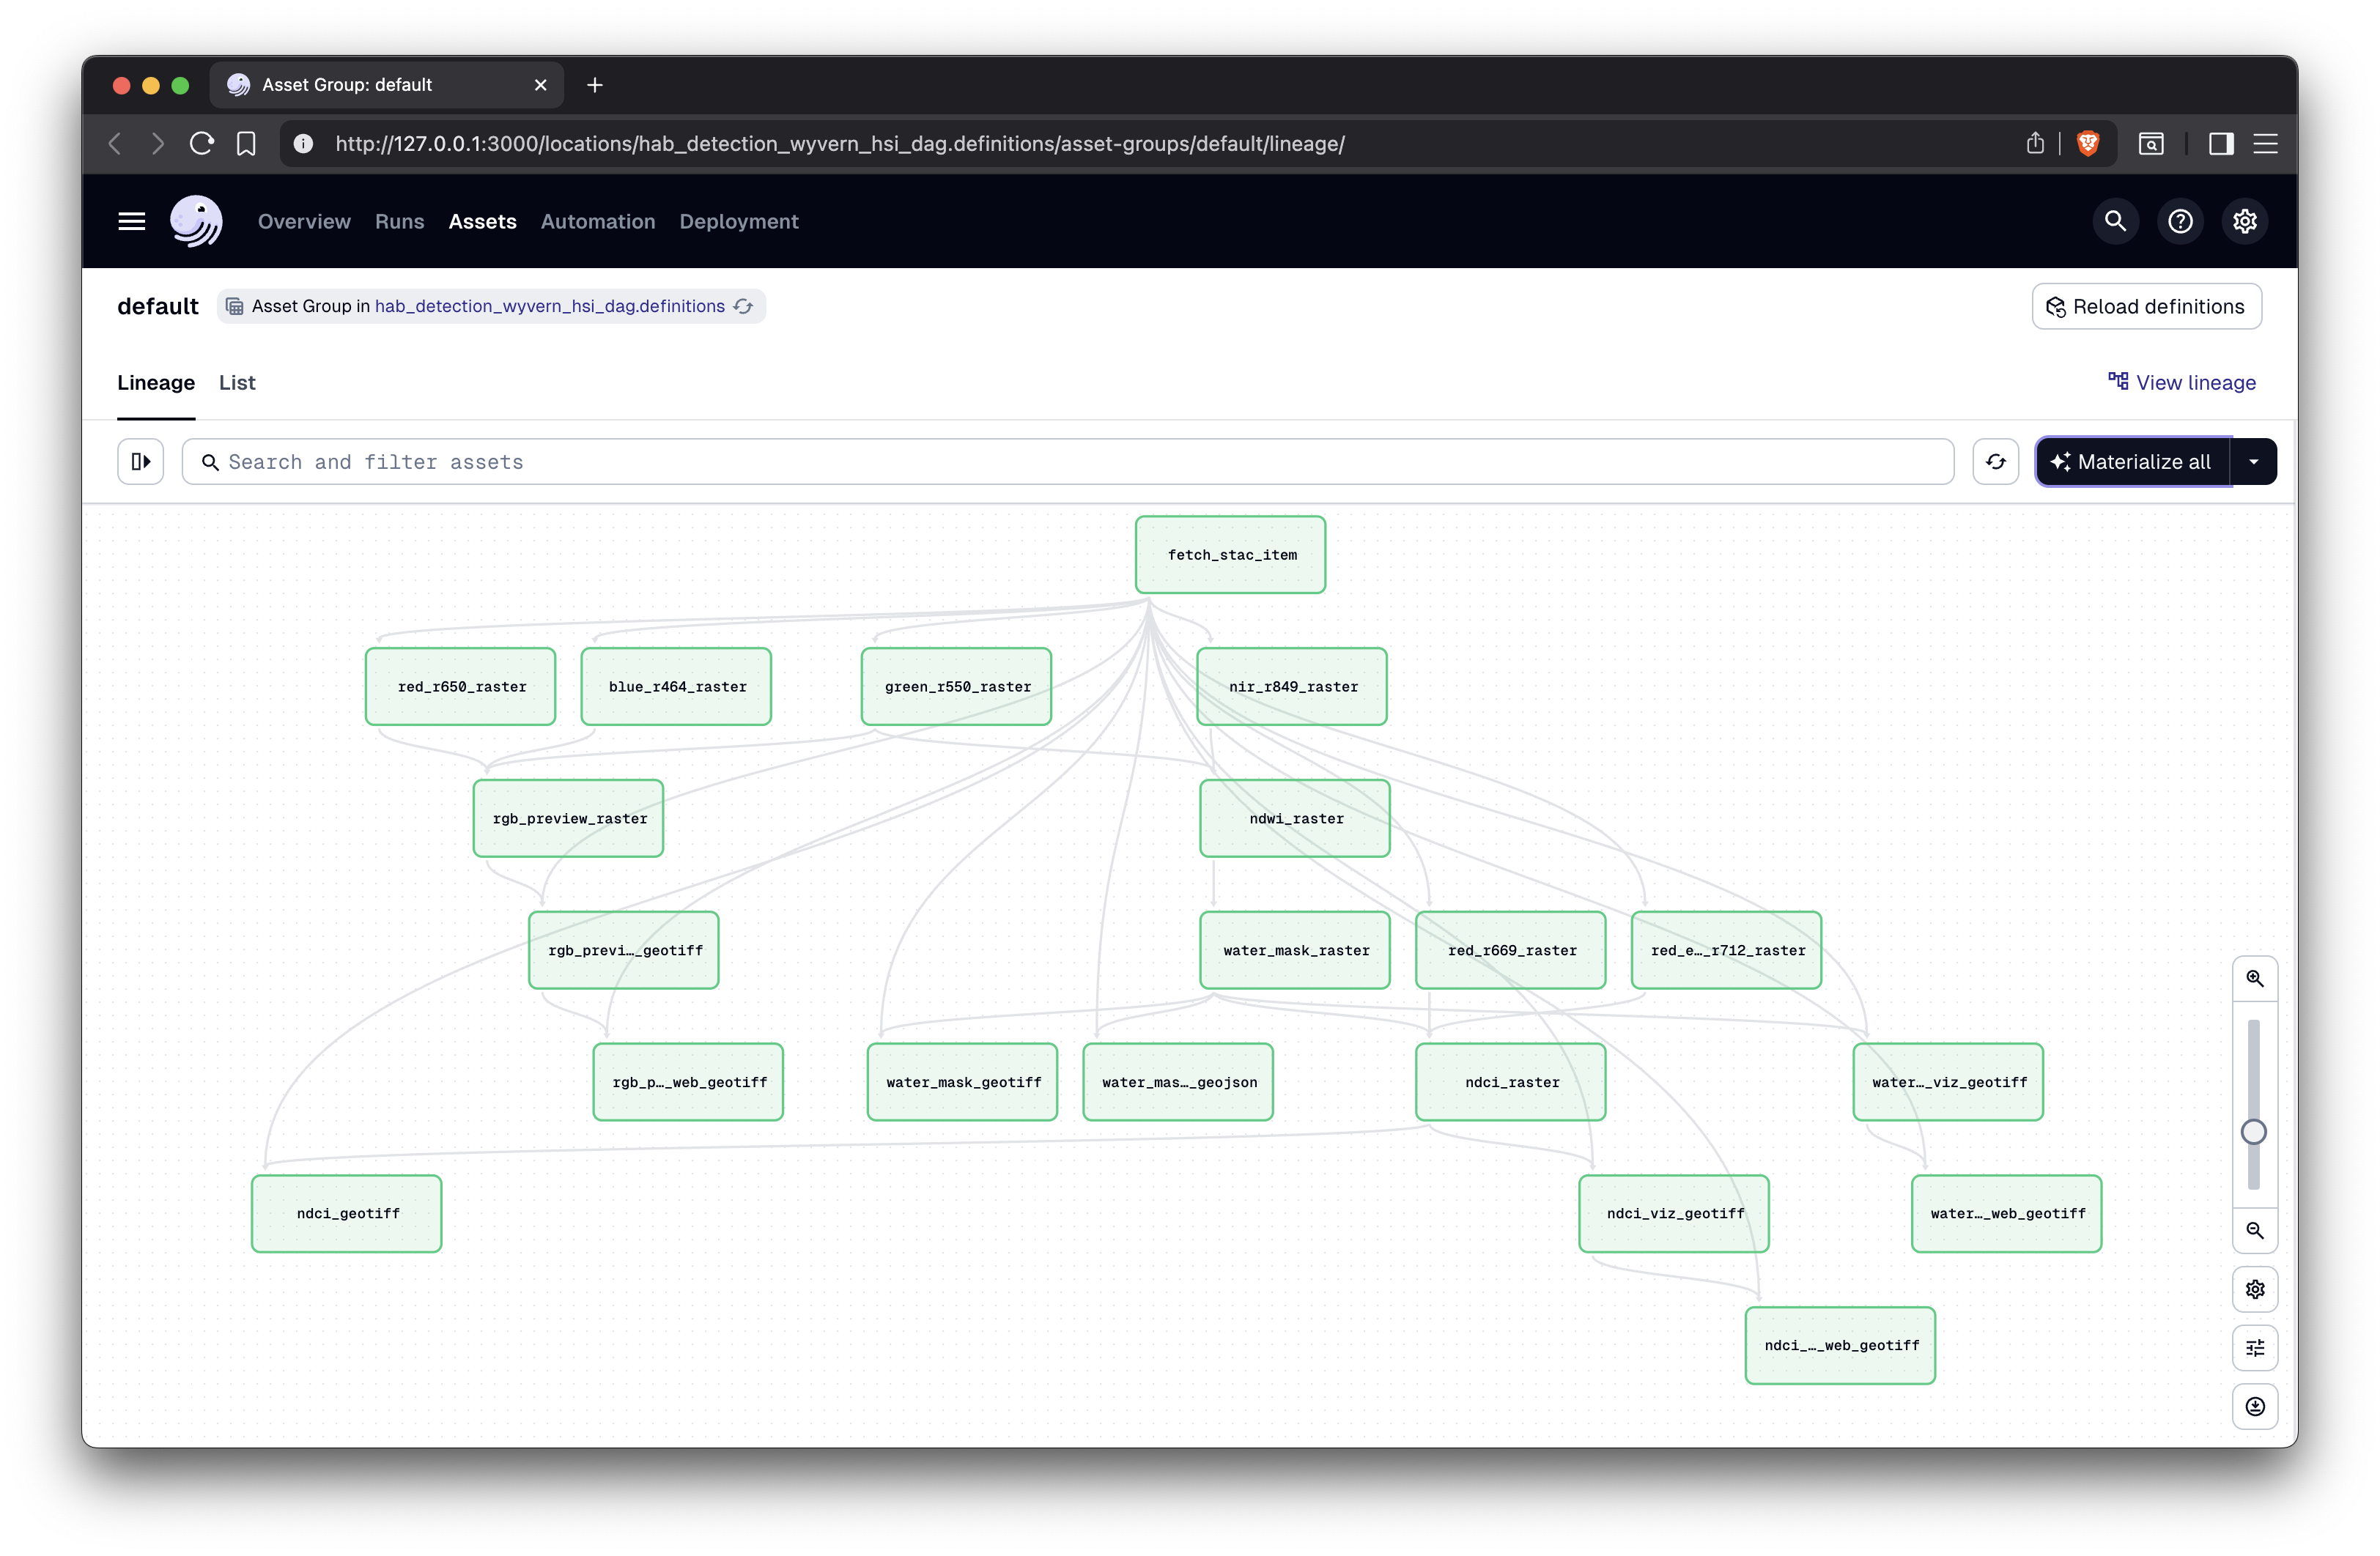 [The final DAG in Lineage view in Dagster]
Python debugger, fix-and-continue, work avoidance 🎉
Because Dagster is both a CLI tool, a web app, and a Python module, it delivers a great development experience. Some aspects which I found beneficial:
- Edit pipeline code, while assets are being materialized! (multitasking)
- Fix errors and then resume processing, right where the pipeline left off (work avoidance)
- Python debugger (F5 debugging with VSCode)
Example launch.json for VSCode
{
    "version": "0.2.0",
    "configurations": [
        {
            "name": "Dagster Dev Server (Debug)",
            "type": "debugpy",
            "request": "launch",
            "module": "dagster",
            "args": ["dev"],
            "justMyCode": true,
            "console": "integratedTerminal",
            "cwd": "${workspaceFolder}",
             "env": {
                "DAGSTER_HOME": "~/.dagster"
            }
        }
    ]
}
Ecosystem of data orchestrator tools
I hope you enjoyed this quick intro to Dagster, which barely scratched the surface of it's capabilities! The greater ecosystem of data orchestrator tools is rich, here is just a small cross section.
- Airflow "Apache Airflow® is a platform created by the community to programmatically author, schedule and monitor workflows."
- Argo Workflows is "an open source container-native workflow engine for orchestrating parallel jobs on Kubernetes."
- AWS Batch
- AWS Glue ETL and Workflows
- AWS Step Functions
- Dask "a Python library for parallel and distributed computing."
- Dbt "turns data work into a shared, scalable practice by bringing the best of software engineering to the analytics workflow."
- Make: that's right, Make has been running software builds, DAGs, and data pipelines in Unix and Linux systems since the 1970's!
Links to source code at NBviewer and GitHub
This walkthrough blog post was just a high level view. The GitHub repository has the pipeline source code, and Jupyter notebook.
🌎 Thanks for rambling! 👋🏼